The Event Overview page provides a comprehensive view of your event's key details, trends, and tools for effective management.
Accessing Event Overview:
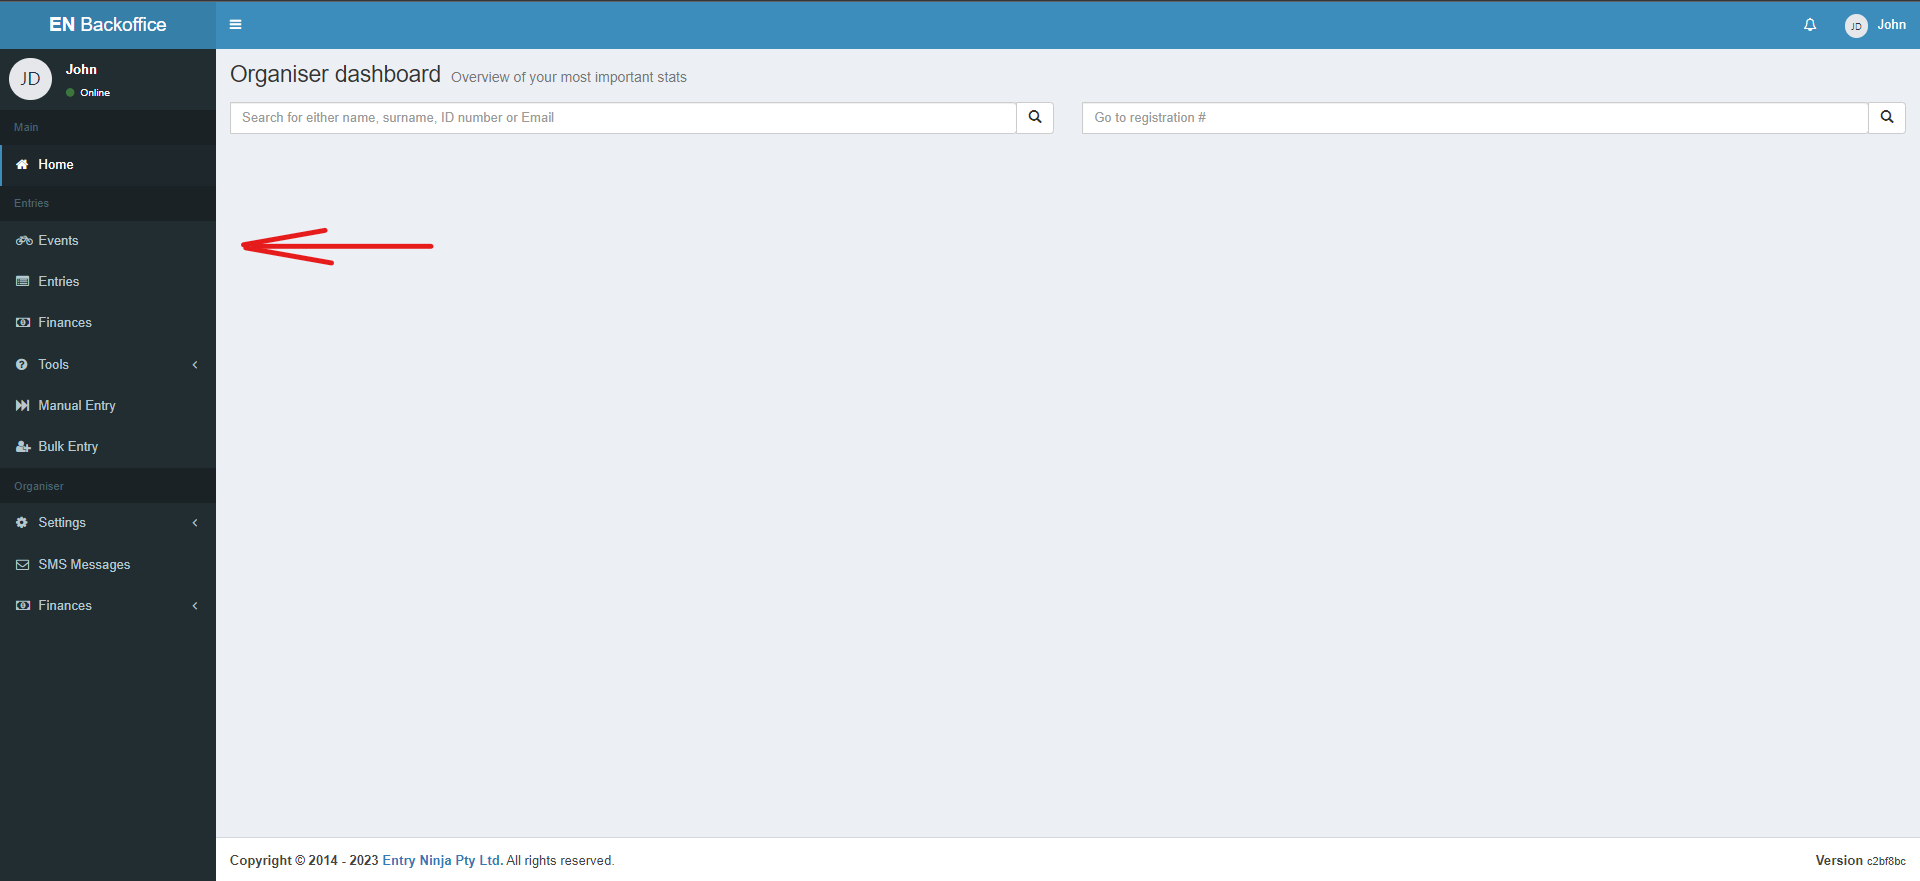
1. Click on "Events" in the menu bar.
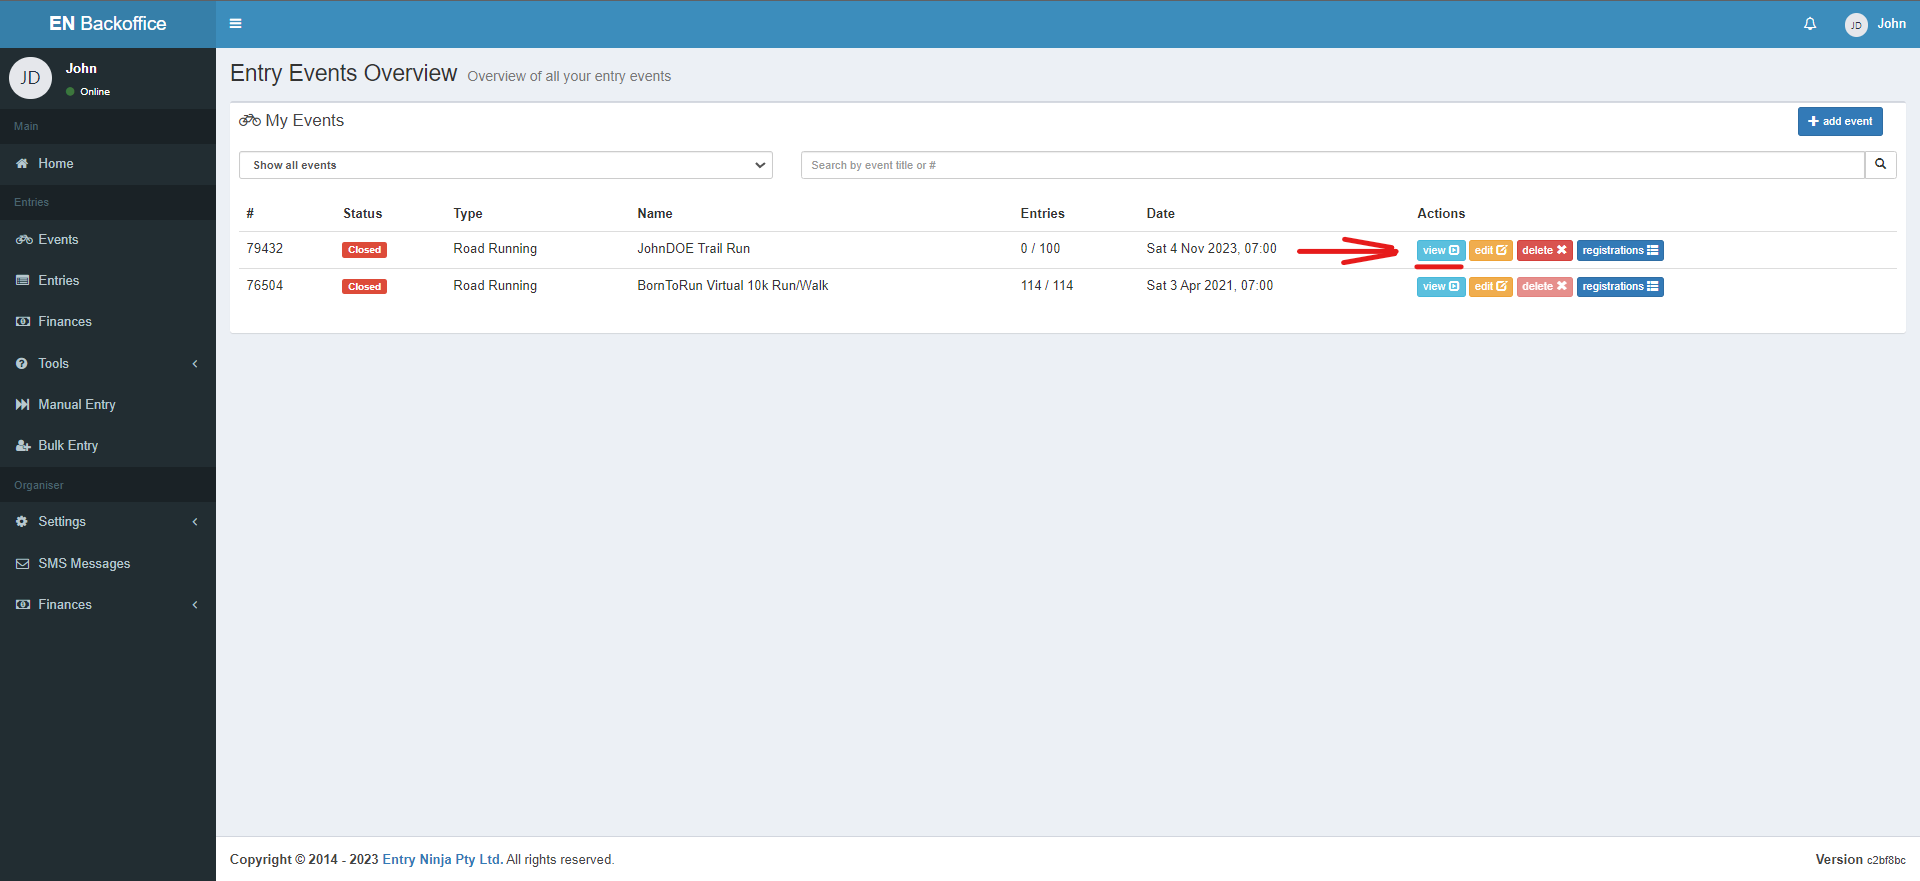
2. Click on the "View" option next to the relevant event.
Key Components:
1. Recent Entries Trend Graph: Visualize a 30-day trend of entry submissions, highlighting the busiest days of the month.
2. Classes View: Explore all available classes or distances within your event, along with the number of entries received for each.
3. Participant Summary: Get insights into participant demographics, including average age and the ratio of total registrations to total members entered.
4. Payment Systems: View the active payment methods for your event, providing clarity on how participants can pay.
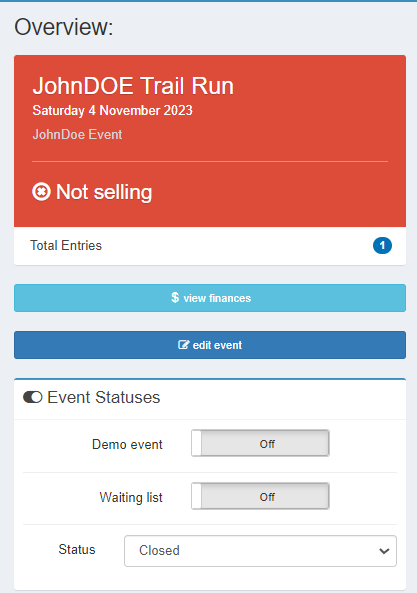
5. Event Statuses: Manage your event's availability by opening or closing it, enabling waiting lists, and using demo options.
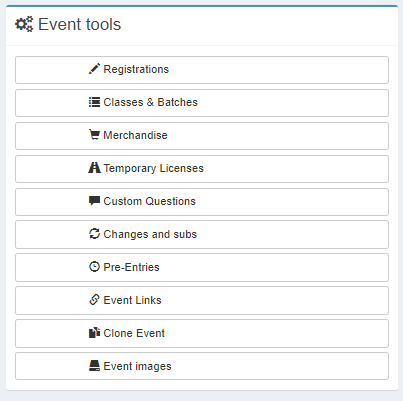
6. Event Tools: Access a suite of event management tools tailored to your event's needs.
7. Event Graphs: Gain visual insights through graphs, such as paid vs unpaid, new vs returning participants, gender distribution, team vs solo entries, and payment method breakdown.
8. Participant Age Groups: Visualize participant age distribution with graphs showing the number of participants in each age group.
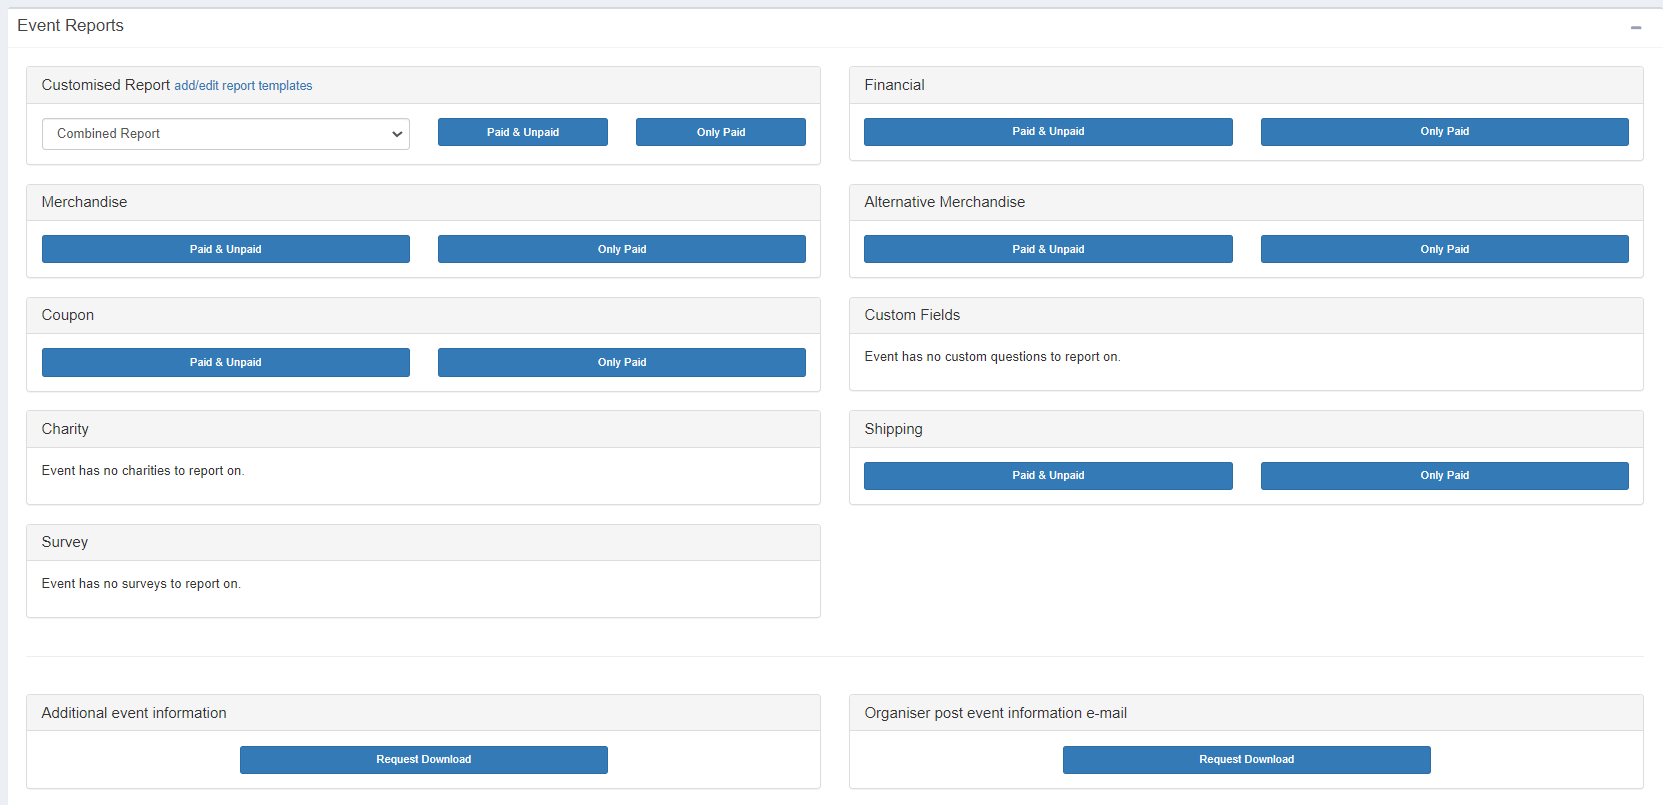
9. Event Reports: Download various reports pertinent to your event, such as financial summaries and participant data.
10. Reminders: Manage event-related email reminders, including unpaid entry reminders and pre-event information emails.

